Example: Animated Plots
Having animated plots would be cool. Let’s try to figure out how to export them as video files or animated GIFs or something.
Plots using for loops
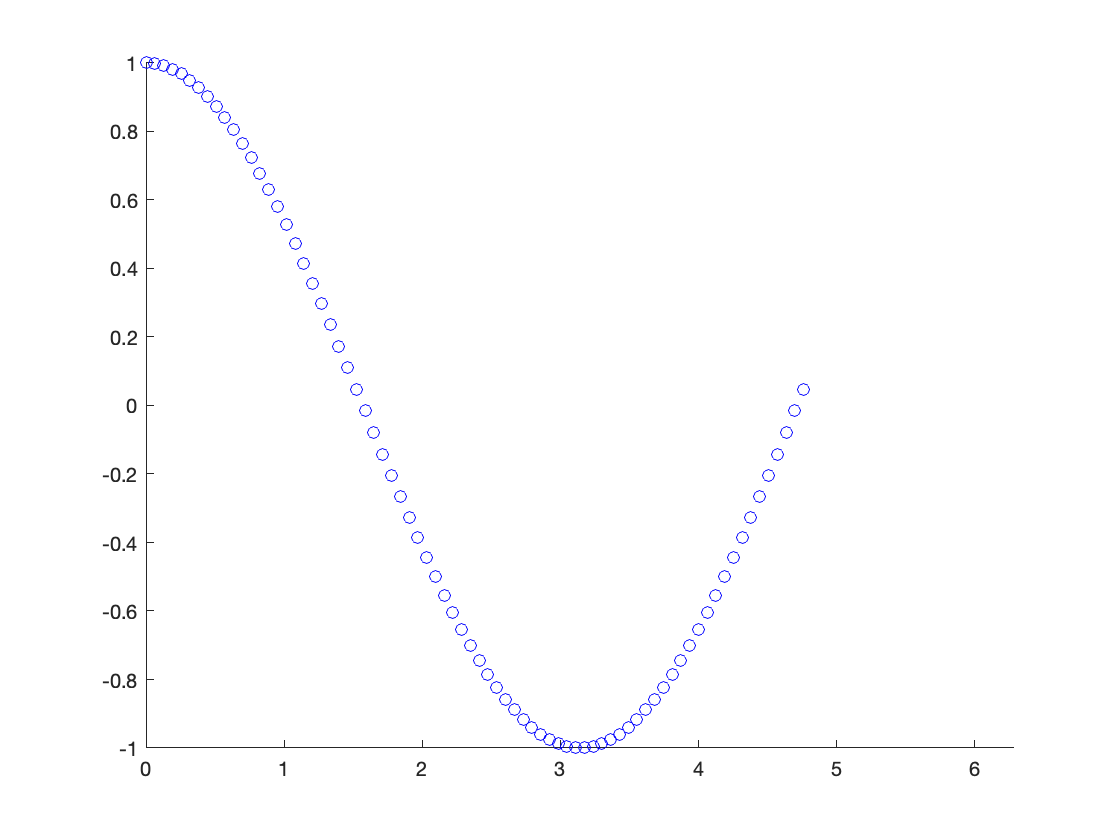
Here’s an example of animated plots that you get when you plot stuff in a loop in a Live Script.
ax = axes;
axis(ax, [0, 2*pi, -1, 1])
hold(ax, "on")

for i = linspace(0, 2*pi)
    scatter(ax, i, cos(i), 'b')
    drawnow
    pause(0.025)
end
When you run the Live Script, it only does one pass through the sequence. How should we handle that?
Plots using movie
Maybe you can also do animated plots using the movie function.
First, you have to enable it in the editor:
if verLessThan('matlab', '9.10.0')
    mlSettings = settings;
    mlSettings.matlab.editor.AllowFigureAnimation.TemporaryValue = 1;
end
(This is probably not safe to do in widely-used Live Scripts. An onCleanup and a clear could somewhat take care of this.)
Record the movie:
% Code taken from Matlab's `doc movie`
figure
Z = peaks;
surf(Z)
axis tight manual
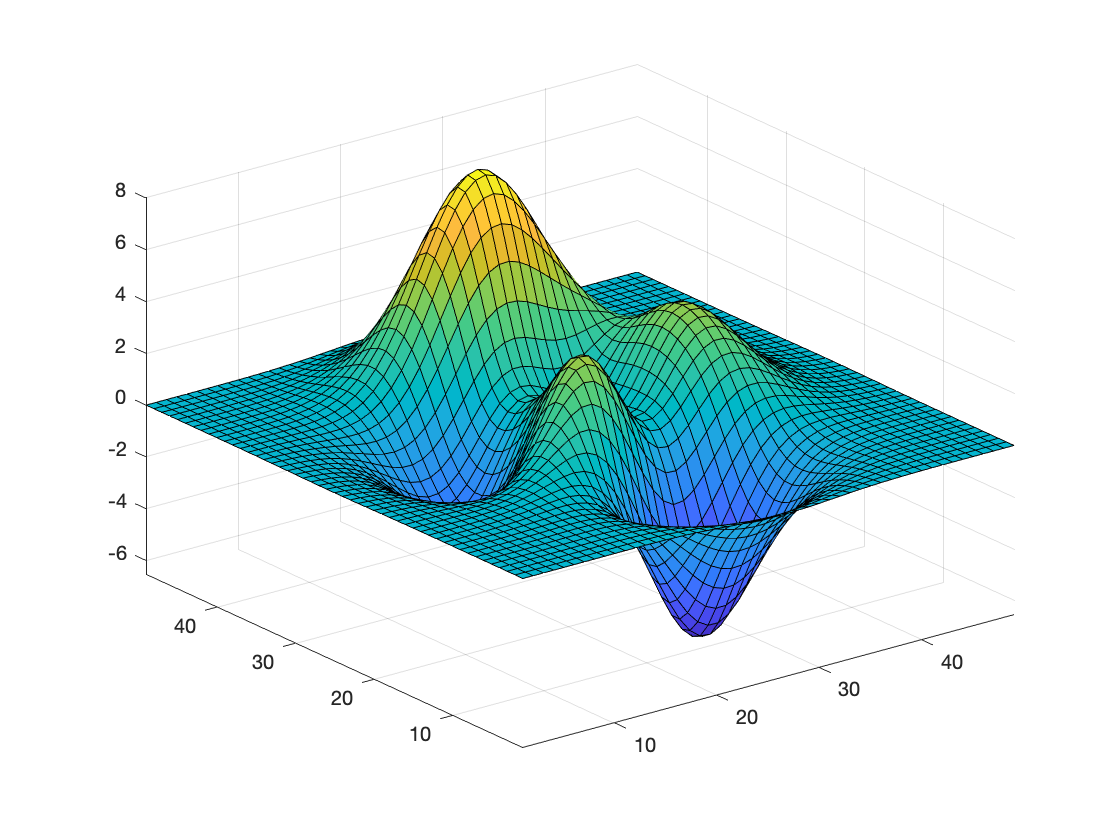
ax = gca;
ax.NextPlot = 'replaceChildren';
loops = 40;
F(loops) = struct('cdata',[],'colormap',[]);
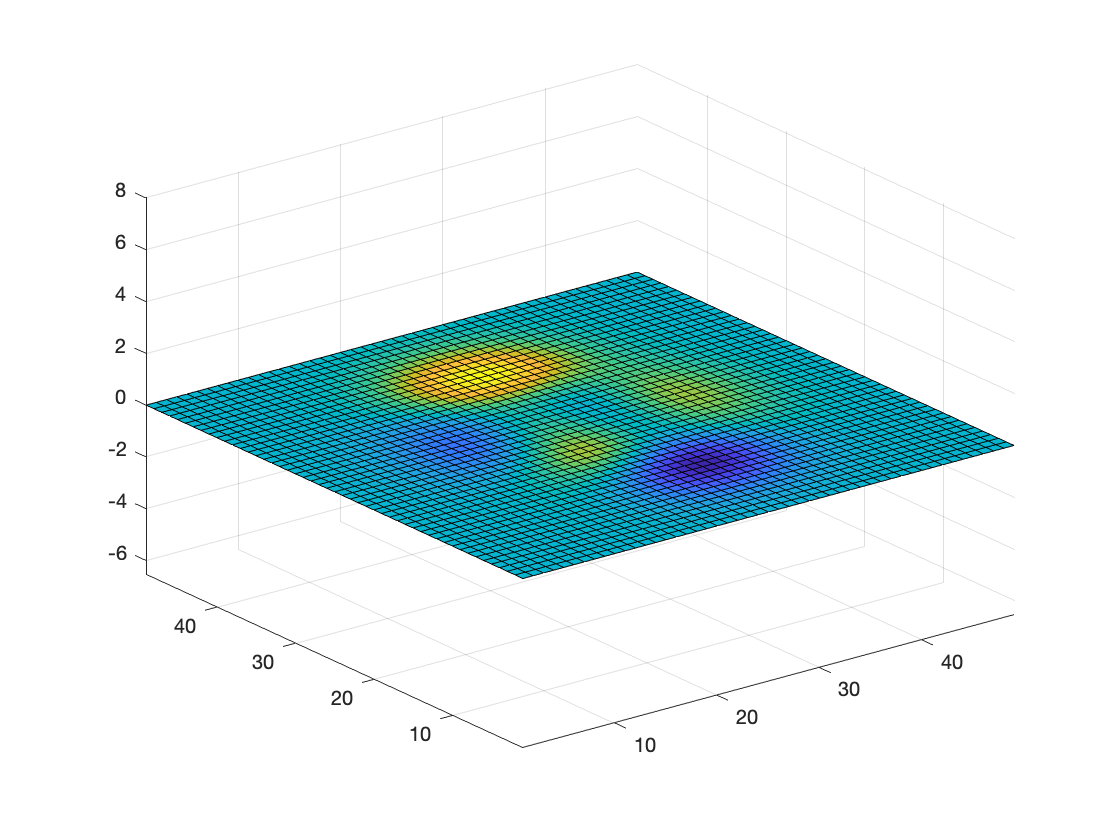
for i = 1:loops
X = sin(i*pi/10)*Z;
surf(X,Z);
drawnow
F(i) = getframe;
end
Then play it back:
movie(F,2);
Does that work?
Hmm. Doesn’t look like it.
New R2021a Live Script movie support
R2021a has better support for this: https://blogs.mathworks.com/pick/2021/03/26/animation-playback-controls-in-live-scripts-r2021a/. I can’t get that to work yet, though.
Note: R2021 release notes say: “Animation playback controls are not supported for animations generated by the movie function.”